Follow-Up Study Deviation
Use this report to see, question by question, how often a graduating class's post-graduation answers match what they said before graduating. It shows where students' plans held and where they changed.
Last updated About 8 hours ago
Available in: Jobready CTE, Jobready CCR, Jobready WBL
Filters
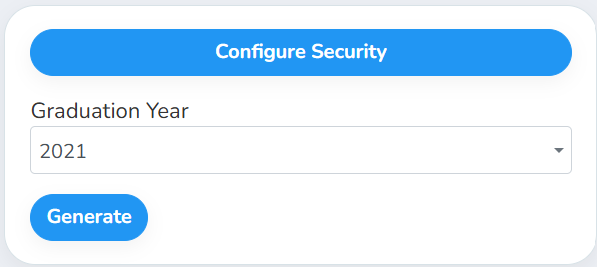
Graduation Year is required.
What's in the file
One row per follow-up question, with these columns:
Good to know
Percentages only use students who answered both. Students who answered just one questionnaire are counted in the "Answer Only" columns instead.
Matching ignores capitalization and extra spaces, so "Yes" and "yes " count as the same answer.
Some questions are left out. Questions marked Excluded From Deviation and deleted questions don't appear. A question also won't appear if no one in that graduating class answered it.
Percentages aren't rounded. Format the column in your spreadsheet to show the number of decimal places you want.
Your access applies. The counts only include students you have access to, and they use your selected school and class. Graduates are included.
Student data: This report shows counts and percentages for each question. It doesn't list individual students or their answers.
Related reports
Follow-Up Study Responses: see each student's individual answers
Was this helpful?
Still need help? Ask the team